Purpose
To view a breakdown of your estimated final costs and budget, by individual locations. This report will contain a column for each location (episode).
How to use
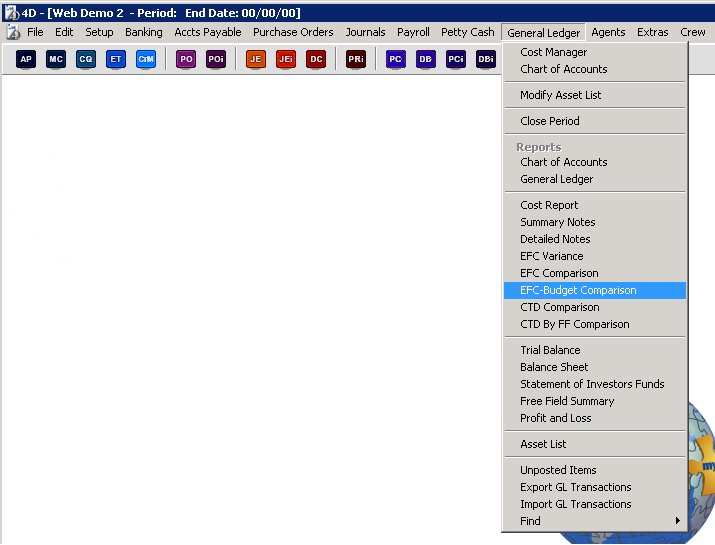
To print the report, select ‘General Ledger’ – ‘EFC-Budget Comparison’ menu item as shown below.

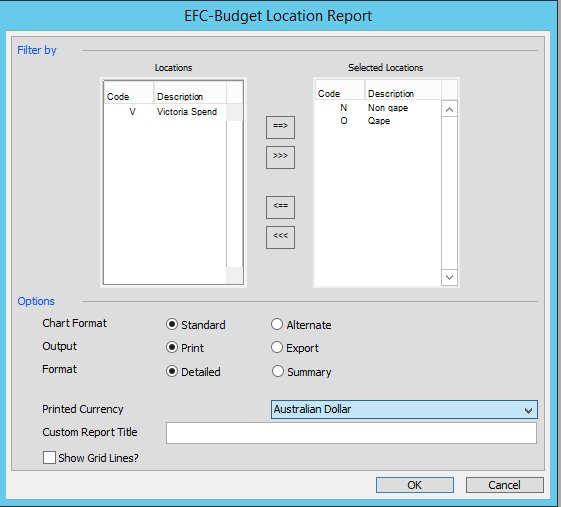
You will then be presented with the following form to make your selections.

From here you can choose exactly which locations to print on the report by moving them across to the ‘Selected Locations’ grid. By default of course all Locations are selected.
Please note due to A4 or US Letter paper size, only 7 Locations can print at the one time on the report. However if you choose the ‘Export’ option you can export 255 locations and view them in Excel.
Above you can also choose to print the Moneypenny standard chart numbers or an alternate chart number, choose what currency to print the report in and provide a unique title to the report. You can also choose to print the grid lines on the report or print a detailed or summary version of the data. If you choose to summarize you can pick at which level of your chart to print.
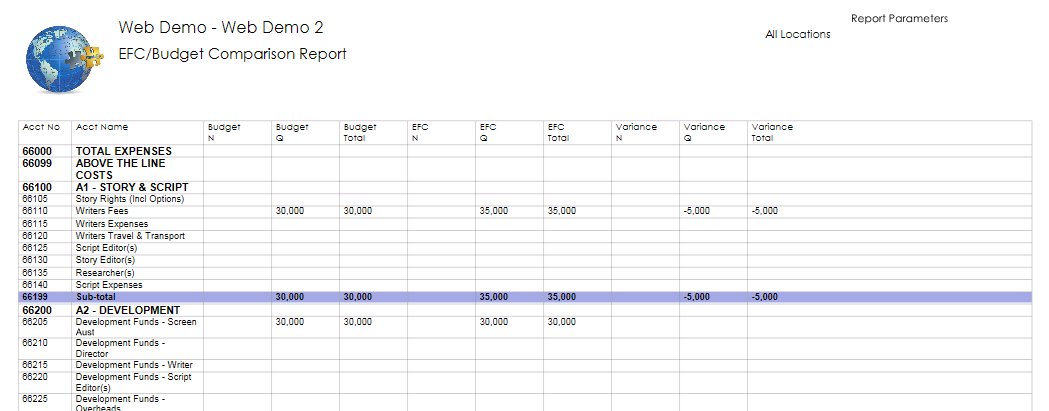
Once you have made your selection, press the ‘OK’ button and the report will print (or export to your desktop) as below.

Please click on the image to view it full screen, then the back button to return.
